Introducing Julia/Plotting
绘图
[编辑]Julia 有许多不同的绘图包,应该会有一款适合您的需要,合您口味。本节是对其中一种绘图包 Plots.jl 的快速介绍,它非常有趣,因为它与许多其他绘图软件包进行了交互。在使用Julia进行绘图之前,请下载并安装一些绘图包 (请先在 REPL 中键入 ] 进入 pkg 模式)
(v1.0) pkg> add Plots PyPlot GR UnicodePlots
第一个包,Plots,是一个高级绘图包,它为其他绘图包 (这里称为“后端”backend )提供一个统一的接口,而这些后端则充当生成图形的图形“引擎”。每个后端都是一个独立的绘图包,可以单独使用,但使用 Plots 的优点是,它提供给您一个更简单更一致的接口。
通过下面的代码,您可以开始在 Julia 会话中使用 Plots.jl 这个绘图包。
julia> using Plots
一般来说,您会需要将一个或者多个 序列 (即数值数组)绘制成图,或者也可以提供一个或多个函数来生成这些数值。
如果您想继续探究,这里使用的示例数据是一个简单的数值数组,表示当前年份中每天的 均时差 的值。(这些值曾用于调整机械时钟,以解释地球绕椭圆轨道摆动时的不稳定轨道。)
julia> using Astro # you'll need to add this package with:  add https://github.com/cormullion/Astro.jl
julia> using Dates
julia> days = Dates.datetime2julian.(Dates.DateTime(2018, 1, 1, 0, 0, 0):Dates.Day(1):Dates.DateTime(2018, 12, 31, 0, 0, 0))
julia> eq_values = map(equation_time, days)
我们现在有了一组 Float64 类型的数据,每个数据表示一年中每天的数值:
365-element Array{Float64,1}:
 -3.12598
 -3.59633
 -4.97289
 -5.41857
 -5.85688
  ⋮
 -1.08709
 -1.57435
 -2.05845
 -2.53887
 -3.01508
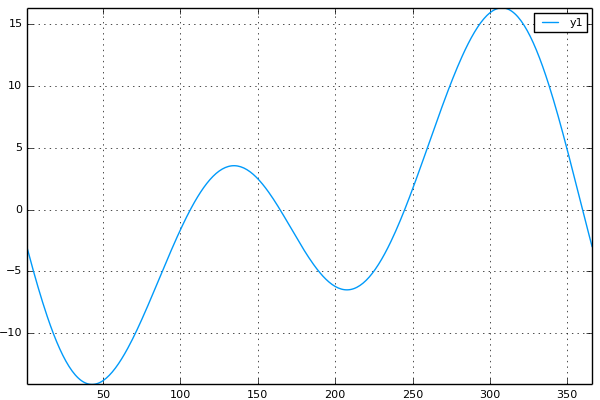
要对这一组数据绘图,只需要把它传入到 Plots 的 plot() 函数中。
julia> plot(eq_values)
这使用了第一个可用的绘图引擎。Plot 将该系列视为 y 值,添加了其他打印值,自动提供与您提供的 y 值相匹配的 x 值,然后为您打印所有内容。
如果你想要选择不同的绘图引擎,使用提供的几个函数 gr(), unicodeplots(), plotly() 以及其他的。例如,选择 Unicodeplots 绘图包(会使用 Unicode 字符绘图,这是在 REPL/终端 上的最佳选择):
julia> unicodeplots()

julia> plot(eq_values)
       +------------------------------------------------------------+
    17 |                                                ,--u        | y1
       |                                              ./   "\       |
       |                                             ./      \      |
       |                                            ./        .     |
       |                                            /         \.    |
       |                                           /           \    |
       |                                          .`           ",   |
       |                                         ,`             \   |
       |                   .r--\.                /               .  |
       |                  /`    \.              /                \  |
       |----------------nr-------fhr-----------v------------------v*|
       |               .F          \.         ,`                  |.|
       |,              /            \,       ,/                    `|
       |l             /              "\.    ,`                      |
       |".           /                 \-ur/`                       |
       | \.         /`                                              |
       |  l        ,`                                               |
       |   \      ./                                                |
       |   "\.  ./`                                                 |
   -15 |     '--"                                                   |
       +------------------------------------------------------------+
       0                                                          370
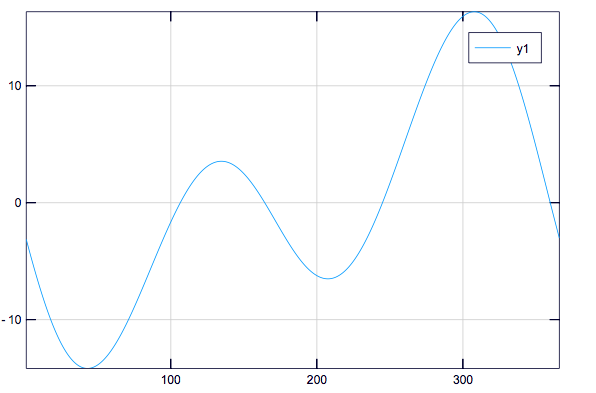
GR 引擎/后端 也是一个很好的通用绘图软件包:
julia> gr();
julia> plot(eq_values)
绘制函数图像
[编辑]Switch back to using PyPlot back-end:
julia> pyplot()
The Equation of Time graph can be approximately modeled by a function combining a couple of sine functions:
julia> equation(d) = -7.65 * sind(d) + 9.87 * sind(2d + 206);
It's easy to plot this function for every day of a year. Pass the function to plot(), and use a range to specify the start and end values:
julia> plot(equation, 1:365)
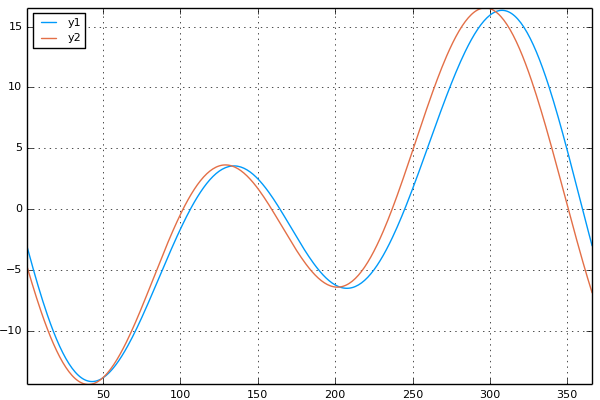
To combine the two plots, so as to compare the equation and the calculated series versions, Plots lets you add another plot to an existing one. The usual Julia convention of using "!" to modify the argument is available here (in an implicit way — you don't actually have to provide the current plot as an argument): the second plot function, plot!() modifies the previous plot:
julia> plot(eq_values);

julia> plot!(equation, 1:365)
自定义绘图
[编辑]There is copious documentation for the Plots.jl package, and after studying it you'll be able to spend hours tweaking and customizing your plots to your heart's content. Here are a few examples.
The ticks along the x-axis show the numbers from 1:365, derived automatically from the single series provided. It would be better to see the dates themselves. First, create the strings:
julia> days = Dates.DateTime(2018, 1, 1, 0, 0, 0):Dates.Day(1):Dates.DateTime(2018, 12, 31, 0, 0, 0)
julia> datestrings = Dates.format.(days, "u dd")
The supplied value for the xticks option is a tuple consisting of two arrays/ranges:
(xticks = (1:14:366, datestrings[1:14:366])
the first provides the numerical values, the second provides matching text labels for the ticks.
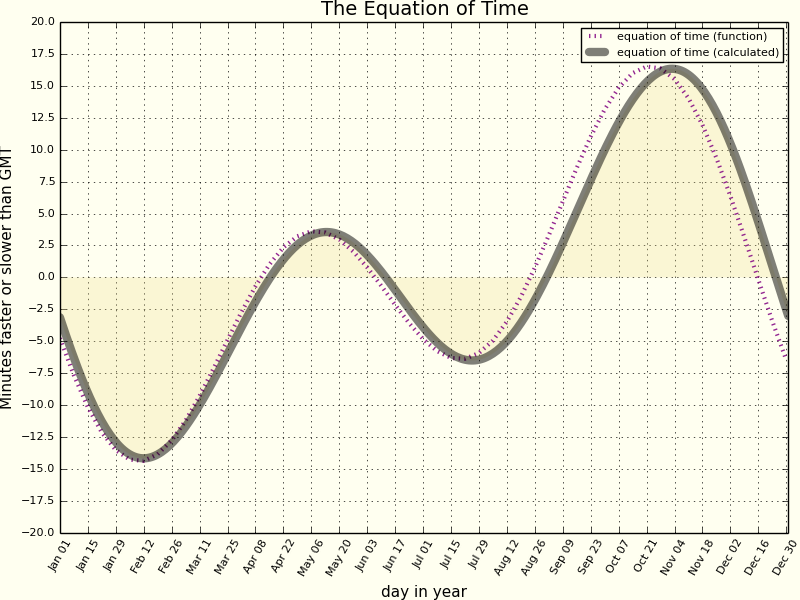
Extra labels and legends are easily added, and you can access colors from the Colors.jl package. Here's a prettier version of the basic plot:
julia>  plot!(
    eq_values,

    label  = "equation of time (calculated)",
    line=(:black, 0.5, 6, :solid),

    size=(800, 600),

    xticks = (1:14:366, datestrings[1:14:366]),
    yticks = -20:2.5:20,

    ylabel = "Minutes faster or slower than GMT",
    xlabel = "day in year",

    title  = "The Equation of Time",
    xrotation = rad2deg(pi/3),

    fillrange = 0,
    fillalpha = 0.25,
    fillcolor = :lightgoldenrod,

    background_color = :ivory
    )
其他包
[编辑]UnicodePlots
[编辑]If you work in the REPL a lot, perhaps you want a quick and easy way to draw plots that use text rather than graphics for output? The UnicodePlots.jl package uses Unicode characters to draw various plots, avoiding the need to load various graphic libraries. It can produce:
- scatter plots
- line plots
- bar plots (horizontal)
- staircase plots
- histograms (horizontal)
- sparsity patterns
- density plots
Download and add it to your Julia installation, if you haven't already done so:
pkg> add UnicodePlots
You have to do this just once. Now you load the module and import the functions:
julia> using UnicodePlots
Here is a quick example of a line plot:
julia> myPlot = lineplot([1, 2, 3, 7], [1, 2, -5, 7], title="My Plot", border=:dotted)
                       My Plot
      ⡤⠤⠤⠤⠤⠤⠤⠤⠤⠤⠤⠤⠤⠤⠤⠤⠤⠤⠤⠤⠤⠤⠤⠤⠤⠤⠤⠤⠤⠤⠤⠤⠤⠤⠤⠤⠤⠤⠤⠤⠤⢤
   10 ⡇⠀⠀⠀⠀⠀⠀⠀⠀⠀⠀⠀⠀⠀⠀⠀⠀⠀⠀⠀⠀⠀⠀⠀⠀⠀⠀⠀⠀⠀⠀⠀⠀⠀⠀⠀⠀⠀⠀⠀⠀⢸
      ⡇⠀⠀⠀⠀⠀⠀⠀⠀⠀⠀⠀⠀⠀⠀⠀⠀⠀⠀⠀⠀⠀⠀⠀⠀⠀⠀⠀⡠⠄⠀⠀⠀⠀⠀⠀⠀⠀⠀⠀⠀⢸
      ⡇⠀⠀⠀⠀⠀⠀⠀⠀⠀⠀⠀⠀⠀⠀⠀⠀⠀⠀⠀⠀⠀⠀⠀⠀⢀⠔⠊⠀⠀⠀⠀⠀⠀⠀⠀⠀⠀⠀⠀⠀⢸
      ⡇⠀⠀⠀⠀⠀⠀⠀⠀⠀⠀⠀⠀⠀⠀⠀⠀⠀⠀⠀⠀⠀⢀⡠⠊⠁⠀⠀⠀⠀⠀⠀⠀⠀⠀⠀⠀⠀⠀⠀⠀⢸
      ⡇⠀⠀⠀⠀⠔⠒⠊⠉⢣⠀⠀⠀⠀⠀⠀⠀⠀⠀⠀⡠⠔⠁⠀⠀⠀⠀⠀⠀⠀⠀⠀⠀⠀⠀⠀⠀⠀⠀⠀⠀⢸
      ⡇⠉⠉⠉⠉⠉⠉⠉⠉⠉⠫⡉⠉⠉⠉⠉⠉⢉⠝⠋⠉⠉⠉⠉⠉⠉⠉⠉⠉⠉⠉⠉⠉⠉⠉⠉⠉⠉⠉⠉⠁⢸
      ⡇⠀⠀⠀⠀⠀⠀⠀⠀⠀⠀⠱⡀⠀⢀⡠⠊⠁⠀⠀⠀⠀⠀⠀⠀⠀⠀⠀⠀⠀⠀⠀⠀⠀⠀⠀⠀⠀⠀⠀⠀⢸
      ⡇⠀⠀⠀⠀⠀⠀⠀⠀⠀⠀⠀⠑⠔⠁⠀⠀⠀⠀⠀⠀⠀⠀⠀⠀⠀⠀⠀⠀⠀⠀⠀⠀⠀⠀⠀⠀⠀⠀⠀⠀⢸
      ⡇⠀⠀⠀⠀⠀⠀⠀⠀⠀⠀⠀⠀⠀⠀⠀⠀⠀⠀⠀⠀⠀⠀⠀⠀⠀⠀⠀⠀⠀⠀⠀⠀⠀⠀⠀⠀⠀⠀⠀⠀⢸
  -10 ⡇⠀⠀⠀⠀⠀⠀⠀⠀⠀⠀⠀⠀⠀⠀⠀⠀⠀⠀⠀⠀⠀⠀⠀⠀⠀⠀⠀⠀⠀⠀⠀⠀⠀⠀⠀⠀⠀⠀⠀⠀⢸
      ⠓⠒⠒⠒⠒⠒⠒⠒⠒⠒⠒⠒⠒⠒⠒⠒⠒⠒⠒⠒⠒⠒⠒⠒⠒⠒⠒⠒⠒⠒⠒⠒⠒⠒⠒⠒⠒⠒⠒⠒⠒⠚
      0                                       10
And here's a density plot:
julia> myPlot = densityplot(collect(1:100), randn(100), border=:dotted)
      ⡤⠤⠤⠤⠤⠤⠤⠤⠤⠤⠤⠤⠤⠤⠤⠤⠤⠤⠤⠤⠤⠤⠤⠤⠤⠤⠤⠤⠤⠤⠤⠤⠤⠤⠤⠤⠤⠤⠤⠤⠤⢤
   10 ⡇                                        ⢸
      ⡇                                        ⢸
      ⡇                                        ⢸
      ⡇                                        ⢸
      ⡇                                        ⢸
      ⡇                                        ⢸
      ⡇                                        ⢸
      ⡇                            ░           ⢸
      ⡇ ░░░        ░ ▒░  ▒░     ░  ░ ░ ░ ░   ░ ⢸
      ⡇░░  ░▒░░▓▒▒ ▒░░ ▓░░ ░░░▒░ ░ ░   ▒ ░ ░▒░░⢸
      ⡇▓▒█▓▓▒█▓▒▒▒█▒▓▒▓▒▓▒▓▓▒▓▒▓▓▓█▒▒█▓▒▓▓▓▓▒▒▒⢸
      ⡇    ░     ░         ░░░ ░    ▒ ░ ░ ░░ ░ ⢸
      ⡇                          ░             ⢸
      ⡇                                        ⢸
      ⡇                                        ⢸
      ⡇                                        ⢸
      ⡇                                        ⢸
      ⡇                                        ⢸
      ⡇                                        ⢸
  -10 ⡇                                        ⢸
      ⠓⠒⠒⠒⠒⠒⠒⠒⠒⠒⠒⠒⠒⠒⠒⠒⠒⠒⠒⠒⠒⠒⠒⠒⠒⠒⠒⠒⠒⠒⠒⠒⠒⠒⠒⠒⠒⠒⠒⠒⠒⠚
      0                                      100
(Note that it needs the terminal environment for the displayed graphs to be 100% successful - when you copy and paste, some of the magic is lost.)
VegaLite
[编辑]allows you to create visualizations in a web browser window. VegaLite is a visualization grammar, a declarative format for creating and saving visualization designs. With VegaLite you can describe data visualizations in a JSON format, and generate interactive views using either HTML5 Canvas or SVG. You can produce:
- Area plots
- Bar plots/Histograms
- Line plots
- Scatter plots
- Pie/Donut charts
- Waterfall charts
- Wordclouds
To use VegaLite, first add the package to your Julia installation. You have to do this just once:
pkg> add VegaLite
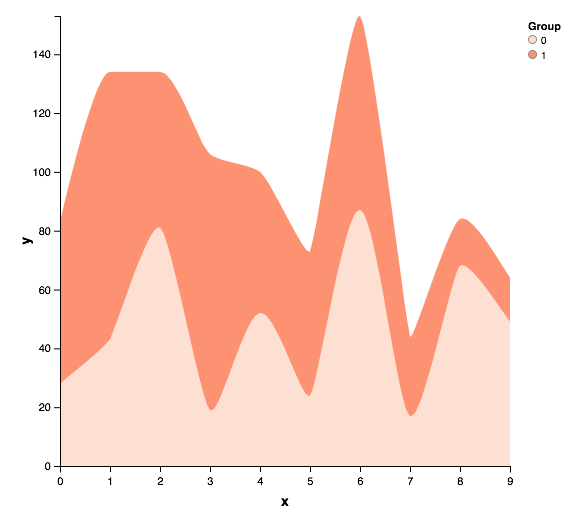
Here's how to create a stacked area plot.
julia> using VegaLite
julia> x = [0,1,2,3,4,5,6,7,8,9,0,1,2,3,4,5,6,7,8,9]
julia> y = [28, 43, 81, 19, 52, 24, 87, 17, 68, 49, 55, 91, 53, 87, 48, 49, 66, 27, 16, 15]
julia> g = [0,0,0,0,0,0,0,0,0,0,1,1,1,1,1,1,1,1,1,1]

julia> a = areaplot(x = x, y = y, group = g, stacked = true)
A general feature of VegaLite is that you can modify a visualization after you've created it. So, let's change the color scheme using a function (notice the "!" to indicate that the arguments are modified):
julia> colorscheme!(a, ("Reds", 3))
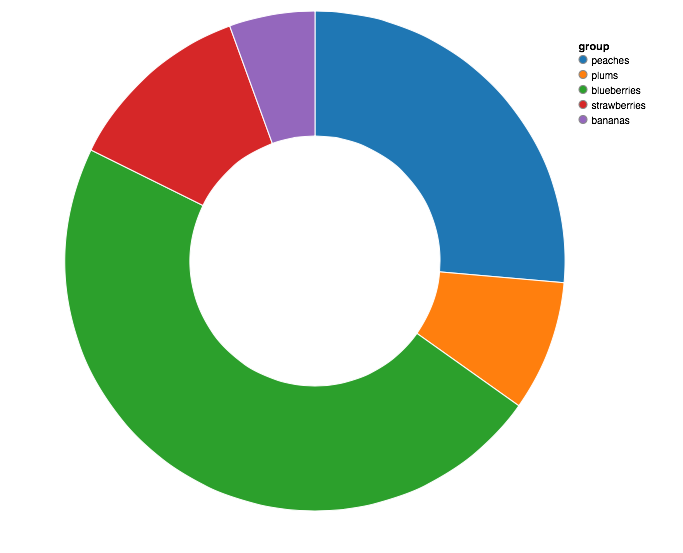
You can create pie (and donut) charts easily by supplying two arrays. The x array provides the labels, the y array provides the quantities:
julia> fruit = ["peaches", "plums", "blueberries", "strawberries", "bananas"];
julia> bushels = [100, 32, 180, 46, 21];
julia> piechart(x = fruit, y = bushels, holesize = 125)

