
File:Mouvement des planètes au cours du temps.png

原始文件 (4,931 × 2,786像素,文件大小:2.28 MB,MIME类型:image/png)
摘要
| 描述 |
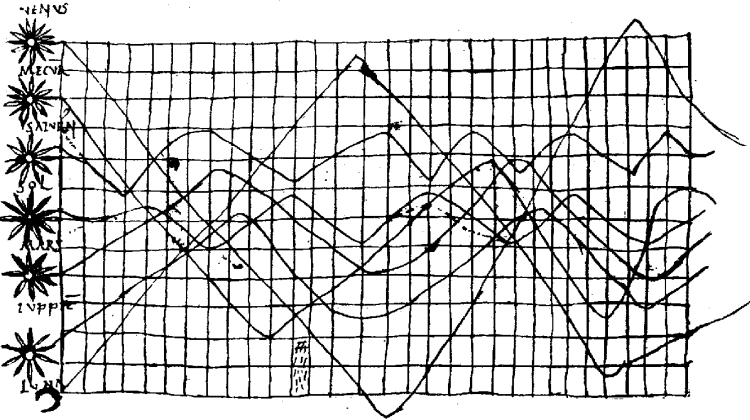
English: Planetary Movements, depicted as Cyclic Lines on a Spacial-Temporal Grid. In De cursu zodiacum (by Pliny?), given as an appendix to a copy of Macrobius' Commentary on Cicero's Somnium Scipionis (CLM 14436, a convolute of four mss. of the late 10th and early 11th century for use in monastery schools; substantial portions are written by one Hartwic)
This is the earliest known 2-dimensional charts (plotting time vs. celestial latitude; an apparent anomaly is that it appears to show the celestial latitude of the sun varying with time); the scribe used horizontal and vertical lines as aids, resulting in a picture strikingly similar to modern graph paper as it did not become commonly used before the mid 19th century, some 700 years later. This picture is a notable anomaly, as the earliest comparable "graph" diagram do not emerge prior to the late medieval period, some 250 years after this drawing was made. The graph was first described by Günther (1877). Literature
Nederlands: Het oudst bekende voorbeeld van een grafiek, met op de horizontale as de tijd, komt uit een manuscript uit de tiende of elfde eeuw dat aan het einde van de vorige eeuw werd teruggevonden. Het is een soort diagram dat de bewegingen van de planeten (Venus, Mercurius, etc.) aangeeft t.o.v. de Dierenriem (zie Funkhouser 1936).
Om het tekenen te vergemakkelijken heeft de tekenaar de horizontale as in 30 en de verticale as in 12 stukjes verdeeld, waardoor een soort ruitjespapier is ontstaan. Het zou nog tot ongeveer 1850 duren voordat het gebruik van grafiekenpapier min of meer gemeengoed werd.
Français : Description du mouvement des planètes au cours du temps, publié au Xème siècle par Macrobius dans son ouvrage Commentarii in Somnium Scipionis |
| 日期 | 10世纪或11世纪 |
| 来源 |
Commentarii in Somnium Scipionis, A.T. Macrobius. CLM 14436 fol. 61r, reproduced in [https://www.jstor.org/stable/301609 Funkhouser (1936)], immediate source here (fisme.science.uu.nl) |
| 作者 | 匿名 |
| 其他版本 |

许可协议
|
这是一个平面公有领域艺术品的忠实摄影副本。原艺术品本身因为下列原因属于公有领域:
维基媒体基金会的官方立场认为:“对平面公有领域艺术品的忠实再制作品也属于公有领域。”
因此,可以认为此摄影副本在美国也属于公有领域。在其他司法管辖区,再利用此内容可能存在限制;参见再利用PD-Art照片了解详细信息。 |
文件历史
点击某个日期/时间查看对应时刻的文件。
| 日期/时间 | 缩略图 | 大小 | 用户 | 备注 | |
|---|---|---|---|---|---|
| 当前 | 2020年4月18日 (六) 19:59 | | 4,931 × 2,786(2.28 MB) | Sette-quattro | higher quality, cleaned and cropped version of https://commons.wikimedia.org/wiki/File:Clm_14436_ecliptic_diagram.png |
| 2016年10月1日 (六) 14:12 |  | 676 × 378(83 KB) | Cmdrjameson | Compressed with pngout. Reduced by 114kB (57% decrease). | |
| 2013年11月1日 (五) 09:54 |  | 676 × 378(197 KB) | PAC2 | User created page with UploadWizard |
文件用途
没有页面使用本文件。
全域文件用途
以下其他wiki使用此文件:
- bn.wikipedia.org上的用途
- en.wikipedia.org上的用途
- fr.wikipedia.org上的用途
- gl.wikipedia.org上的用途
- it.wikipedia.org上的用途
- ja.wikipedia.org上的用途
- ro.wikipedia.org上的用途
- uk.wikipedia.org上的用途