
File:Polarisation (Linear).svg

原始檔案 (SVG 檔案,表面大小:250 × 625 像素,檔案大小:11 KB)
.svg?uselang=zh-tw)
.svg?uselang=zh-tw)
.svg?action=history&uselang=zh-tw)
.svg)
| 描述 |
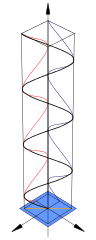
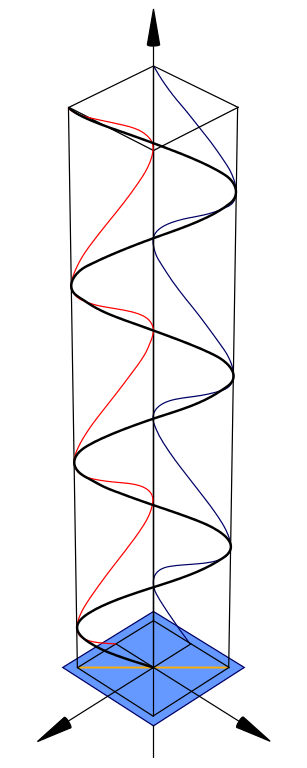
Diagram of linear polarisation. The direction of the black line relative to the central axis represents the direction of the electric field of the linearly polarized light at each point in space. The blue and red lines are projections of the black onto two planes which are at right angles. There is an version which is identical to this original with the exception of phase indictors to make the phase relationship of its components clearer. Refer to Other Versions section below. |
||
| 日期 | 12/02/07 | ||
| 來源 |
Own drawing down in Mathematica, edited in the Open Source program Inscape. 本vector image使用Inkscape創作 . |
||
| 作者 | inductiveload | ||
| 授權許可 (重用此檔案) |
|
||
| 其他版本 |
Derivative works of this file: Polarisation (Linear) With.Phase.Indicators.svg Circular polarisation Elliptical polarisation |
_With.Phase.Indicators.svg)
.svg)
.svg)
Mathematica Code
This figure requires the use of Arrow3D, which is not included in the StandardPackages (as of Feb 2007). This can be obtained from Wolfram Research at this location. The required packages are:
<< Graphics`
<< Arrow3D`Arrow3D`
The code is:
wavefunction=ParametricPlot3D[{Sin[4t],-Sin[4t],t},{t,0,5},
    BoxRatios\[Rule]{1,
      1,4},ImageSize\[Rule]400,Boxed\[Rule]False,Axes\[Rule]False,
      PlotPoints\[Rule]60,ViewPoint->{2,2, 2},PlotRange\[Rule]All]

repsi=ParametricPlot3D[{Sin[4t],-1,t,RGBColor[1,0,0]},{t,0,5},
      BoxRatios\[Rule]{4,1,1},ImageSize\[Rule]500,
      Boxed\[Rule]False,Axes\[Rule]False,
        PlotPoints\[Rule]60,PlotRange\[Rule]All]

impsi=ParametricPlot3D[{-1,-Sin[4t],t,RGBColor[0,0,102/255]},{
    t,0,5},BoxRatios\[Rule]{4,1,1},ImageSize\[Rule]500,Boxed\[Rule]False,
      Axes\[Rule]False,PlotPoints\[Rule]60,PlotRange\[Rule]All]

end=ParametricPlot3D[{Sin[t],-Sin[t],0},{t,0,2π},BoxRatios\[Rule]{4,1,1},
    ImageSize\[Rule]500,Boxed\[Rule]False,Axes\[Rule]False,
      PlotPoints\[Rule]10,PlotRange\[Rule]All]

xaxis=Graphics3D[Arrow3D[{0,0,-1},{
  0,0,6},HeadSize \[Rule] UniformSize[.5],HeadColor\[Rule]Black]]

uaxis=Graphics3D[Arrow3D[{0,-1,0},{0,3,0},HeadSize \[Rule]
    UniformSize[.5],HeadColor\[Rule]Black]]

vaxis=Graphics3D[Arrow3D[{-1,0,0},{3,0,0},HeadSize \[Rule]
      UniformSize[.5],HeadColor\[Rule]Black]]

plane=Graphics3D[Polygon[{{1.2,1.2,0},{1.2,-1.2,0},{-1.2,-1.2,0},{-1.2,1.2,0}}\
]]

crate=WireFrame[Graphics3D[Cuboid[{1,1,0},{-1,-1,5}]]]

Show[wavefunction,xaxis,uaxis,vaxis,plane,repsi,impsi,end,crate]
檔案歷史
點選日期/時間以檢視該時間的檔案版本。
| 日期/時間 | 縮圖 | 尺寸 | 使用者 | 備註 | |
|---|---|---|---|---|---|
| 目前 | 2014年2月13日 (四) 23:12 | 250 × 625(11 KB) | 老陳 | Refine detail. At the top end, match red blue and black lines | |
| 2014年2月13日 (四) 23:02 | 250 × 625(11 KB) | 老陳 | The blue line (y component) should be above the darker blue square plate at the bottome. | ||
| 2007年2月12日 (一) 06:36 | 250 × 625(11 KB) | Inductiveload | |||
| 2007年2月12日 (一) 03:18 | 250 × 625(352 KB) | Inductiveload | {{Information |Description=Diagram of linear polarisation |Source=Own drawing down in Mathematica, edited in Inscape. |Date=12/02/07 |Author=inductiveload |Permission={PD-self} |other_versions=Circular polarisation |
.svg)
檔案用途
沒有使用此檔案的頁面。
全域檔案使用狀況
以下其他 wiki 使用了這個檔案:
- bs.wikipedia.org 的使用狀況
- de.wikipedia.org 的使用狀況
- en.wikipedia.org 的使用狀況
- es.wikipedia.org 的使用狀況
- et.wikipedia.org 的使用狀況
- fr.wikipedia.org 的使用狀況
- fr.wikiversity.org 的使用狀況
- he.wikipedia.org 的使用狀況
- ko.wikipedia.org 的使用狀況
- mk.wikipedia.org 的使用狀況
- no.wikipedia.org 的使用狀況
- ru.wikipedia.org 的使用狀況
- sh.wikipedia.org 的使用狀況
- tr.wikipedia.org 的使用狀況
- uk.wikipedia.org 的使用狀況
- vi.wikipedia.org 的使用狀況
.svg)